


| 古风第三次解读美国房市前景 |
| 送交者: 远古的风 2012年05月05日12:51:49 于 [焦点房谈] 发送悄悄话 |
|
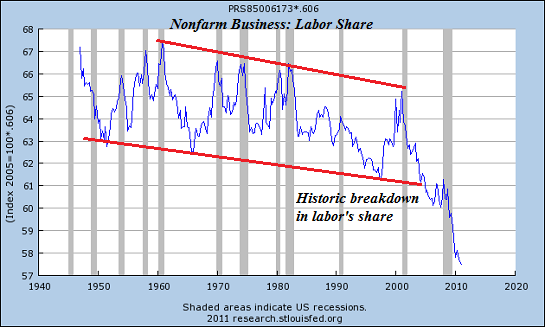
【古风按】关于美国的房市,古风在下面的几篇博文中已经有了很详尽的论述,现在再给大家补充一个视频和两篇英语资料(见下)。在古风以前的论述中,唯一没有谈论到的只有房地产税的问题了,而这将是靠出租房产获取现金流的地主们面对的最致命的麻烦。 【相关阅读】古风解读2012年1月份美国的房市 古风再次解读美国房市 古风解读最新的美国新屋开工图 美国的房市即将迎来再次的大幅下跌 古风四评美国经济现状 古风开讲:美国龙年新气象《八图覤潴》 古风解读2012年1月份美国的就业数据 http://www.oftwominds.com/blogapril12/housing-done4-12.html What If Housing Is Done for a Generation? What if housing valuations are in a structural, multi-decade decline? A strong case can be made that the fundamental supports of the housing market-- demographics, employment, creditworthiness and income--will not recover for a generation. It can even be argued that housing has lost its status as the foundation of middle class wealth, not for a generation, but for the long term. Let's begin by noting that despite the many tax breaks lavished on housing--the mortgage interest deduction, etc.--there is nothing magical about housing as an asset. That is, its price responds in an open, transparent market to supply and demand and the cost of money and risk. There are a number of quantifiable inputs that feed into supply and demand--new housing starts, mortgage rates and income, to name three--but there are other less quantifiable inputs as well, notably the belief (or faith) that housing will return to being a "good investment," i.e. rising in price roughly 1% above the rate of inflation. If this faith erodes, then the other factors of demand face an insurmountable headwind, for the most fundamental support of housing is the belief that buying a house is the first step to securing middle class wealth. Rising rates of homeownership require five conditions: 1. Favorable demographics: a cohort of potential buyers that is larger than the cohort of potential sellers. 2. Rising household formation rates: an expanding population does not necessarily translate into rising rates of household formation. If the number of people per household goes up, then the number of households can plummet even as population expands. 3. A large cohort of creditworthy potential buyers: that means buyers with savings, buyers with sufficient income to pay the mortgage and buyers with low debt loads. 4. An economy that generates rising incomes to support homeownership. 5. An unshakable belief that owning a house is a favorable and secure investment that will rise in value in the decades ahead. If the first four conditions have eroded, then the belief in the permanence of a rising housing market will also erode. The demographics are not favorable to housing on a number of fronts. Jim Quinn recently posted some devastating charts of U.S. demographics in his brilliant post CAUSE, EFFECT & THE FALLACY OF A RETURN TO NORMALCY (The Burning Platform). Without going into too much detail, we can stipulate that the Baby Boom (65 million people) will be downsizing their housing, i.e. selling for the next two decades. We can also stipulate that most of the Baby Boom no longer has the wherewithal to buy second homes; rather, they will be dumping second homes to pay for living expenses as earnings, interest income and housing equity have all cratered since 2007. Not only are there not enough younger workers to buy all these millions of homes that will be put on the market, few of those younger workers have either the creditworthiness or income to buy a house unless the Federal government gives them essentially free money and a no-down payment entry. With the Federal deficit skyrocketing, that sort of giveaway won't last long. Labor's share of the national income has plummeted to historic lows. How can households be expected to buy a house when their real (inflation-adjusted) income declines year after year? Labor share is the portion of output that employers spend on labor costs (wages, salaries, and benefits) valued in each year’s prices. Nonlabor share—the remaining portion of output--includes returns to capital, such as profits, net interest, depreciation, and indirect taxes.
This chart suggests that a fundamental structural shift has taken place since the dot-com bubble popped in 2000: labor's share of the national income is in a secular long-term decline. That does not bode well for household income going forward. Meanwhile, income has declined, especially for younger workers. Soaring Poverty Casts Spotlight on ‘Lost Decade’: According to the Census figures, the median annual income for a male full-time, year-round worker in 2010 — $47,715 — was virtually unchanged, in 2010 dollars, from its level in 1973, when it was $49,065.
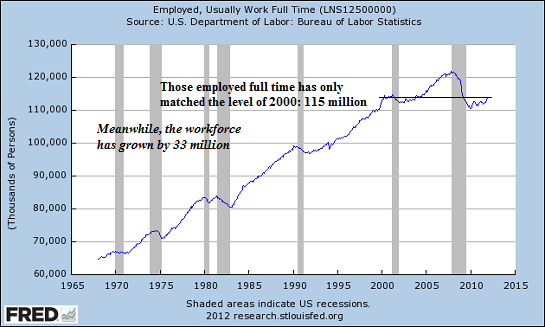
Notice that the only age brackets with flat or rising incomes are the over 55 cohort; everyone younger than 55 has seen their income slashed. And this is assuming "official" inflation is accurate; if it understates real inflation (loss of purchasing power), then the income declines are actually much more severe than charted here. Part-time jobs and temp jobs do not generate enough stable income to support a mortgage. The only measure of employment that really matters in housing is fulltime employment, and that has declined to levels of 1999-2000 even as the workforce has added tens of millions of potential workers (all of whom have been deleted from the official workforce by Federal bean counters as "not in labor force" or "discouraged workers").
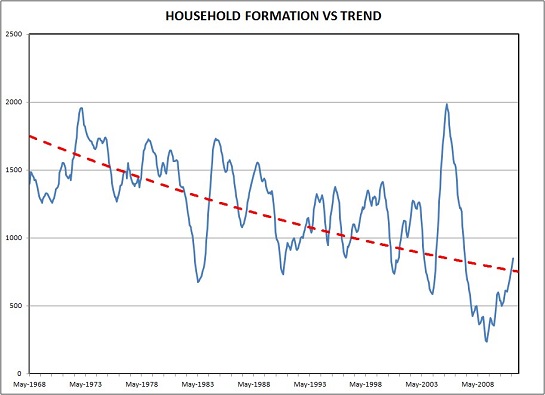
I don't have time to assemble the statistics for this entry, but the number of people with fulltime jobs that pay enough to support a mortgage is smaller than the number of fulltime workers. In other words, people working fulltime at or near minimum wage have a difficult time qualifying for a non-subsidized mortgage. Household formation is also in a long-term decline. The chart depicts the housing bubble spike when marginally qualified people bought homes. Once the bubble popped, household formation plummeted and then returned to the declining trendline.
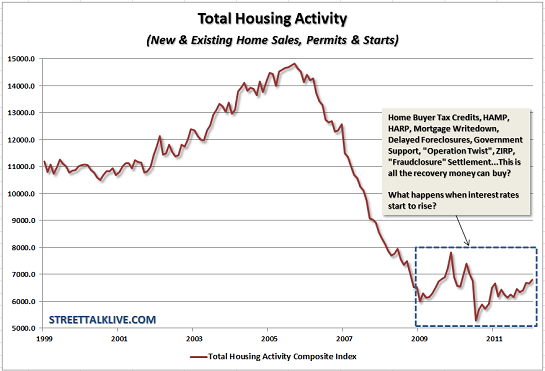
Recall that there are about 130 million housing units in the United States. About 112 million housing units are occupied: 75 million by owners and 37 million by renters. There are are about 19 million vacant dwellings: about 8.5 million second homes and vacation rentals, 2.5 million home for sale and another 8 million "vacant for other reasons" in Census-speak. (All number are approximate, drawn from 2010 Census Bureau data.) If we subtract the 4 million second homes, that leaves about 15 million homes that could be occupied by owners or renters. With an average household size of about 2.5 people, that means we already have enough dwellings to house an additional 15 million households or 37 million people. But this calculation overlooks the financial realities of declining income: the number of people per household is likely rising as fewer people can afford their own homes or apartments. This oversupply of dwellings and soft demand is reflected in this chart of housing activity: despite unprecedented Federal subsidies and Federal Reserve pump-priming (buying impaired mortgages, lowering interest rates, etc.), housing has flatlined.
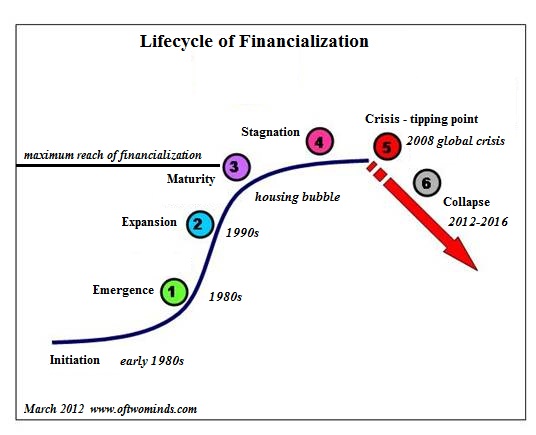
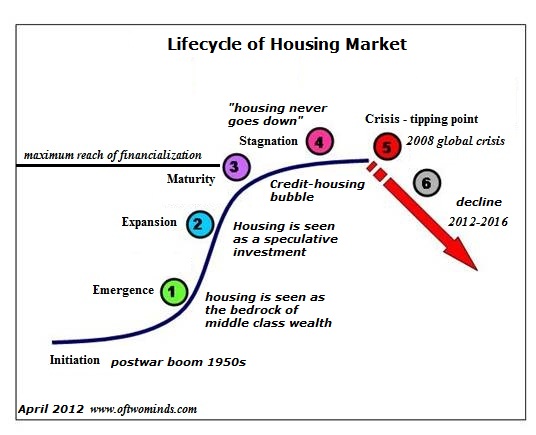
What few are willing to entertain is the possibility that housing is no longer the foundation of middle class wealth, and that its decline is structural, not cyclical. If we think of housing as an asset class that reflects not just demographics and income but financialization (i.e. hollowing out), then perhaps it is simply following the S-curve of financialization:
Lastly, we must consider the impact of declining employment, stagnating income and skyrocketing rates of student-loan debt on the creditworthiness of young potential buyers. If someone exits college with $100,000 in student-loan debt, how much will they have to earn to qualify for a $100,000 mortgage? How many graduates will earn that sum on a secure basis? Perhaps not as many as is generally assumed.
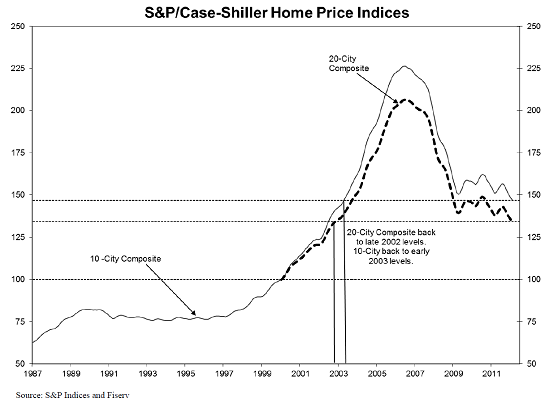
If the risk of default is once again priced into mortgages--that is, if the mortgage market ever ceases to be socialized and 99% guaranteed by Federal agencies--then we can also anticipate higher standards for qualification and a shrinking pool of qualified buyers. It's easy to qualify people for a mortgage. The hard part is making sure they will have enough income and faith to service the mortgage for the next 30 years. If demand is softer than supply, prices will decline. If the belief that housing is the "best, most secure investment" fades, then so too will demand. Declining employment, income and household formation are complex, long-term trends. If they continue trending down, so too will housing. http://www.oftwominds.com/blogapril12/peak-housing4-12.html Peak Housing, Peak Fraud, Peak Suburbia and Peak Property Taxes Peak Housing reflects not just a credit bubble but Peak Fraud and Peak Suburbia. Once again pundits are claiming that housing is "finally recovering." But they're overlooking three peaks: Peak Housing, Peak Financial Fraud, and Peak Suburbia, all of which suggest years of stagnation and decline, not "recovery." Here is the latest Case-Shiller index, which has traced out a nearly textbook bubble and a return to the mean that has been artificially restrained by trillions of dollars of Federal subsidies and backstopping of the housing market:
Here is a classic bubble and pop. Note that the "recovery" to bubble heights never arrived: 12 years later, the NASDAQ is around 3,000. If we adjust that by the 33% inflation since 2000 calculated by the BLS (Bureau of Labor Statistics), then the NAZ is around 40% of the 2000 peak.
Note that there were several "recoveries" that fizzled before the index finally round-tripped to pre-bubble prices. On the Case-Shiller, that suggests an eventual drop from 130 to 75, the pre-bubble level. Like all other systems that have run their course, housing follows an S-curve. After the vaporization of assets and cash in the Great Depression, America had largely reverted to a nation of renters. The postwar boom of plentiful jobs, cheap, government-guaranteed VA mortgages and virgin flat land near cities combined to fuel a suburban housing boom.
By the 1960s, the belief that housing was the bedrock of middle class wealth was firmly established. This was the explanation and motivation for buying a home: "housing never declines," and a rapid rate of household formation made it easy to sell a house to somebody else. The high inflation of the 1970s and subsequent leap in housing prices embedded another key concept in the national psyche: housing wasn't just a forced savings plan that doubled as shelter, it was the speculative road to riches. The mini-bubble of the late 1980s popped, sending housing into a six-year slump, but Peak Financialization and Peak Financial Fraud arose to goose housing to a new and spectacular credit-fueled bubble of frenzied speculation. That systemic fraud was a key dynamic of the housing bubble is undeniable: everyone from those buying houses with no-document loans to money-center banks selling fraudulent mortgage-backed securities was relying on fraud. Peak Fraud isn't a necessary feature of financial bubbles, but it is often a causal factor among others. If you have any doubt that the Crash of 1929 was accompanied by Peak Financial Fraud, I invite you to read John Kenneth Galbraith's The Great Crash 1929. Alas, all bubbles pop, and now the world has changed. The overt fraud has been driven underground, but the repercussions of the institutionalized fraud of MERS and mortgage-backed securities hasn't been resolved; it remains in the market's blood stream, slowly poisoning what's left of the private mortgage market. Peak Fraud will not be returning to the housing market, but its toxic consequences linger in the system. Does anyone seriously think the 4.4 million home equity lines of credit loans (HELOCs) on lenders' books are priced at their true market value? Accounting fraud in the form of overstated mortgage valuations is still rampant, and everyone knows it. The rapid household formation of the 1950s and 60s period has given way to a generational decline. When housing, credit and oil were all cheap and plentiful, single people could buy condos and homes themselves, even with modest incomes. Credit may be cheap but housing and oil are not, and inflation has ravaged incomes, as noted here many times.
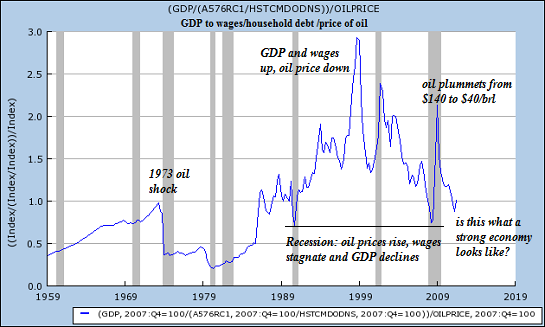
The demographics simply don't support rapid household formation; household formation is following an S-curve, too. Then there's Peak Suburbia and Peak Commuting to Distant Exurban McMansions. Here is a chart that correlates GDP (gross domestic product), the broad measure of economic growth and prosperity, with the price of oil and wages. Note that rising oil costs and stagnant wages take the wind out of the economy's sails.
Simply put, declining wages and high oil prices erode households' ability and willingness to buy a surburban home and pay for the gasoline needed to commute hundreds of miles every week. Declining gasoline consumption is not an outlier, it is also a generational shift. Mish recently addressed this dynamic: Demographics and Changing Social Trends Behind Gasoline Sales Plunge, and I covered the long-term trends in Why Is Gasoline Consumption Tanking? (February 10, 2012) Once the belief that housing is the bedrock of middle class wealth fades, so too will the motivation to risk homeownership in an economy that puts a premium on mobility and frequent changes of careers and jobs. We can discern a sea-change in this chart of housing activity: despite trillions of dollars in subsidies, guaranteed mortgages and other types of Federal support, the housing market has not recovered, it has only stopped plummeting:
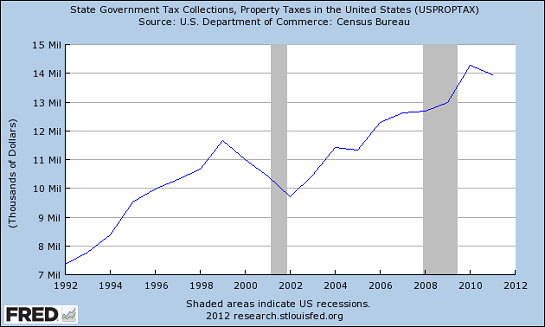
Only one aspect of housing hasn't yet peaked: property taxes. If the risks of homeownership weren't apparent before, they certainly are now as local governments jack up property taxes to indenture homeowners into tax donkeys.
Note that property taxes declined significantly in the previous recession (2000-2002), but they rose steeply in the 2008-9 recession, and continued climbing. The recent modest slippage may have several factors: lower valuations in states that set property taxes on assessed values, tax revenues declining as homes in foreclosure languish with unpaid property taxes, and so on. Anyone claiming that property taxes have peaked will have to support that claim with evidence that local governments have found other sources of tax revenues to replace property taxes. Until that dynamic changes, then local government will have every incentive to jack up property taxes by any and all means available. |
|
|
|
|
 |
 |
| 实用资讯 | |
