


| 汪翔:从技术层面看,美国股市还要升 |
| 送交者: 汪翔 2009年11月17日10:35:36 于 [股市财经] 发送悄悄话 |
|
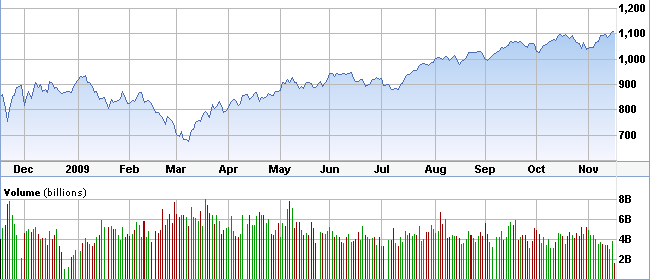
从技术层面看,美国股市还要升 昨天,股指突破几个关键数值关口,并且附带着交易量的上升,说明股市中“牛”的投资者占有上风,“熊”者暂时看来还是需要继续被压抑。 对于S&P500 指数而言,1100点是一个重要关口,对于这个点的突破,就是继9月中旬突破1044关口后的一个更高水平的突破,证明市场在短期内应该向上走,除非有什厶突发性事件出现。在一定的波动之后,下一个关口应该是在1200点附近。不过,在1121点时,代表着从最低点,标准普500已经上升了50%,可能也是一个心理障碍点,可能会有点伤风感冒之类的情形出现。 看来,巴菲特所说的,美国还有很多很好的投资机会,至少在短期内可能会成为现实。 从行业来看,领头羊还是cyclical,已经从最低时上升了1.7倍左右。 这时候的投资策略,不应该是买那些看上去很便宜的股票,而是应该投资那些未来成长强劲的公司的股票。 你付出的是价格,获得的是价值。这句话就是股市成功投资的真理,至少巴菲特证明了这点。
SP500指数一年的变化图 【附录】S&P 500 breaks out; U.S. markets confirm uptrend CINCINNATI (MarketWatch) -- After more than a month of range-bound volatility, the U.S. markets have broken out to start the week. In the process, the Standard & Poor's 500 Index cleared the headline 1,100 mark, confirming its uptrend as detailed below. The S&P 500's hourly chart details the past three weeks. Again, the index has confirmed its uptrend with Monday's spike, breaking sharply atop resistance. From current levels, initial support holds at the breakout point - the 1,100 mark - and is followed by a secondary floor at 1,085. Meanwhile, the Dow Jones Industrial Average remains the strongest major benchmark. As the chart illustrates, it's extended its uptrend, breaking to the year's best levels this week. On the next pullback, initial support points hold around 10,320 and 10,200, and are followed by a firmer floor at 10,120, matching the October peak. And even the Nasdaq Composite has scratched a slight breakout this week. From current levels, initial support holds around 2,180, matching the top of Monday's gap at 2,177. Widening the view to six months adds color. Very simply, the Nasdaq has cleared resistance at the October peak with this week's breakout. In the process, the index has notched a "higher high" confirming its uptrend. Moving to the Dow, it remains the leading U.S. benchmark. Notice the DJIA initially broke out last week -- ahead of the Nasdaq and the S&P -- before extending higher on Monday. Again, its first significant support holds at its breakout point, around 10,120. As for the S&P 500, it has staged this week's headline breakout. As the chart illustrates, the index remains within a series of "higher highs" and "higher lows," defining its uptrend. After more than a month of range-bound volatility, the U.S. markets have broken out to start the week, with the S&P 500 finally clearing the 1,100 mark -- confirming its uptrend. Moving to the SPDR Trust S&P 500's backdrop (SPY, Trade ), the chart above includes volume. Very simply, this week's breakout came on increased volume, strengthening the bull case. Moreover, Monday's market breadth pressed bullish extremes, with up volume surpassing down volume by 7 to 1 on the NYSE. So collectively, the S&P's break atop the 1,100 mark was bullish not just because it marked a "higher high" but also because the breakout came with conviction. Against this backdrop, the S&P 500's two-year view is equally constructive. Notice the index initially broke from its market-crash range top -- the 1,044 level -- in mid-September. And following two months of consolidation -- along with two retests of support -- the S&P has extended its uptrend. Looking ahead, the index faces limited true chart resistance until the 1,200 area, though the 1,121 level marks a 50% retracement of the market crash, and may represent a near-term sticking point. And narrowing the S&P's view to three weeks rounds out the backdrop. From current levels, near-term support points fall out as follows: -- Support at the 1,100 breakout point. -- Support at 1,085, matching last week's low. -- The 20-day moving average, currently 1,080 (not illustrated). Barring a violation of this band -- call it the 1,085 area -- even the very near-term bear case rings hollow. All told, the major benchmarks confirmed their uptrend with this week's breakout, and the U.S. markets' path of least resistance remains higher barring a violation of the October low. The charts below highlight names well positioned technically. These are intended as radar-screen names -- sectors or stocks positioned to move near term. For the original comments on the stocks below, check out The Technical Indicator Library . Drilling down to sectors, the cyclical (CYC ) remain among the market leaders. Notice the group initially staged a steep July breakout following a brief shakeout under the 50-day moving average. By comparison, the subsequent consolidation has been relatively orderly, with an upward bias established, illustrated in blue. Monday's breakout confirms the group's uptrend, positioning it to build on the sharp July rally. The charts below illustrate related names positioned to rise: Dow Chemical (DOW, Trade ), International Paper (IP, Trade ) and CSX Corp. (CSX, Trade ) Best Buy (BBY, Trade ) is a large-cap electronics retailer positioned to rise. As the chart illustrates, it initially broke out earlier this month, clearing resistance at the September and October peaks. The rally preceded the broad-market breakout, and its relative strength positions the shares to further outperform. From current levels, first support holds around $41.50. Profiled last week, MSCI Inc. (MXB, Trade ) remains well positioned. Earlier this month, it spiked to 15-month highs after pricing a secondary offering. Since then, it's pulled in on lighter volume -- constructive price action -- and its near-term outlook remains higher barring a violation of the breakout point. Monsanto Co. (MON, Trade ) is a beaten-down manufacturer of fertilizers and agricultural products. Technically speaking, it spiked on strong volume last week, fueled by the company's updated guidance. Recent strength has the shares challenging a three-month downtrend, and its near-term bias remains higher barring a violation of the 20-day moving average. TRW Automotive Holdings (TRW, Trade ) is a mid-cap maker of automotive systems and related parts. Earlier this month, it spiked to 52-week highs following the company's third-quarter results. Though still extended in the near term, a pullback to the breakout point, around $20.75, would mark an attractive entry. And Precision Castparts (PCP, Trade ) is a well positioned large-cap name. With Monday's gains, the shares cleared resistance at the September peak, notching 52-week highs. The upturn marks a "higher high" -- confirming its uptrend -- and its path of least resistance remains higher barring a violation of the breakout point. |
|
|
|
|
 |
 |
| 实用资讯 | |
|
|
|
|
| 一周点击热帖 | 更多>> |
|
|
|
| 一周回复热帖 |
|
|
|
|
| 历史上的今天:回复热帖 |
| 2008: | 怎麼啦,一點人氣都沒有,大家要看到光 | |
| 2008: | 700 Billion no more | |
| 2006: | ZT海雨:炒股十日记 | |
| 2006: | 加州房市低迷 八年来最冷淡十月 交易减 | |
