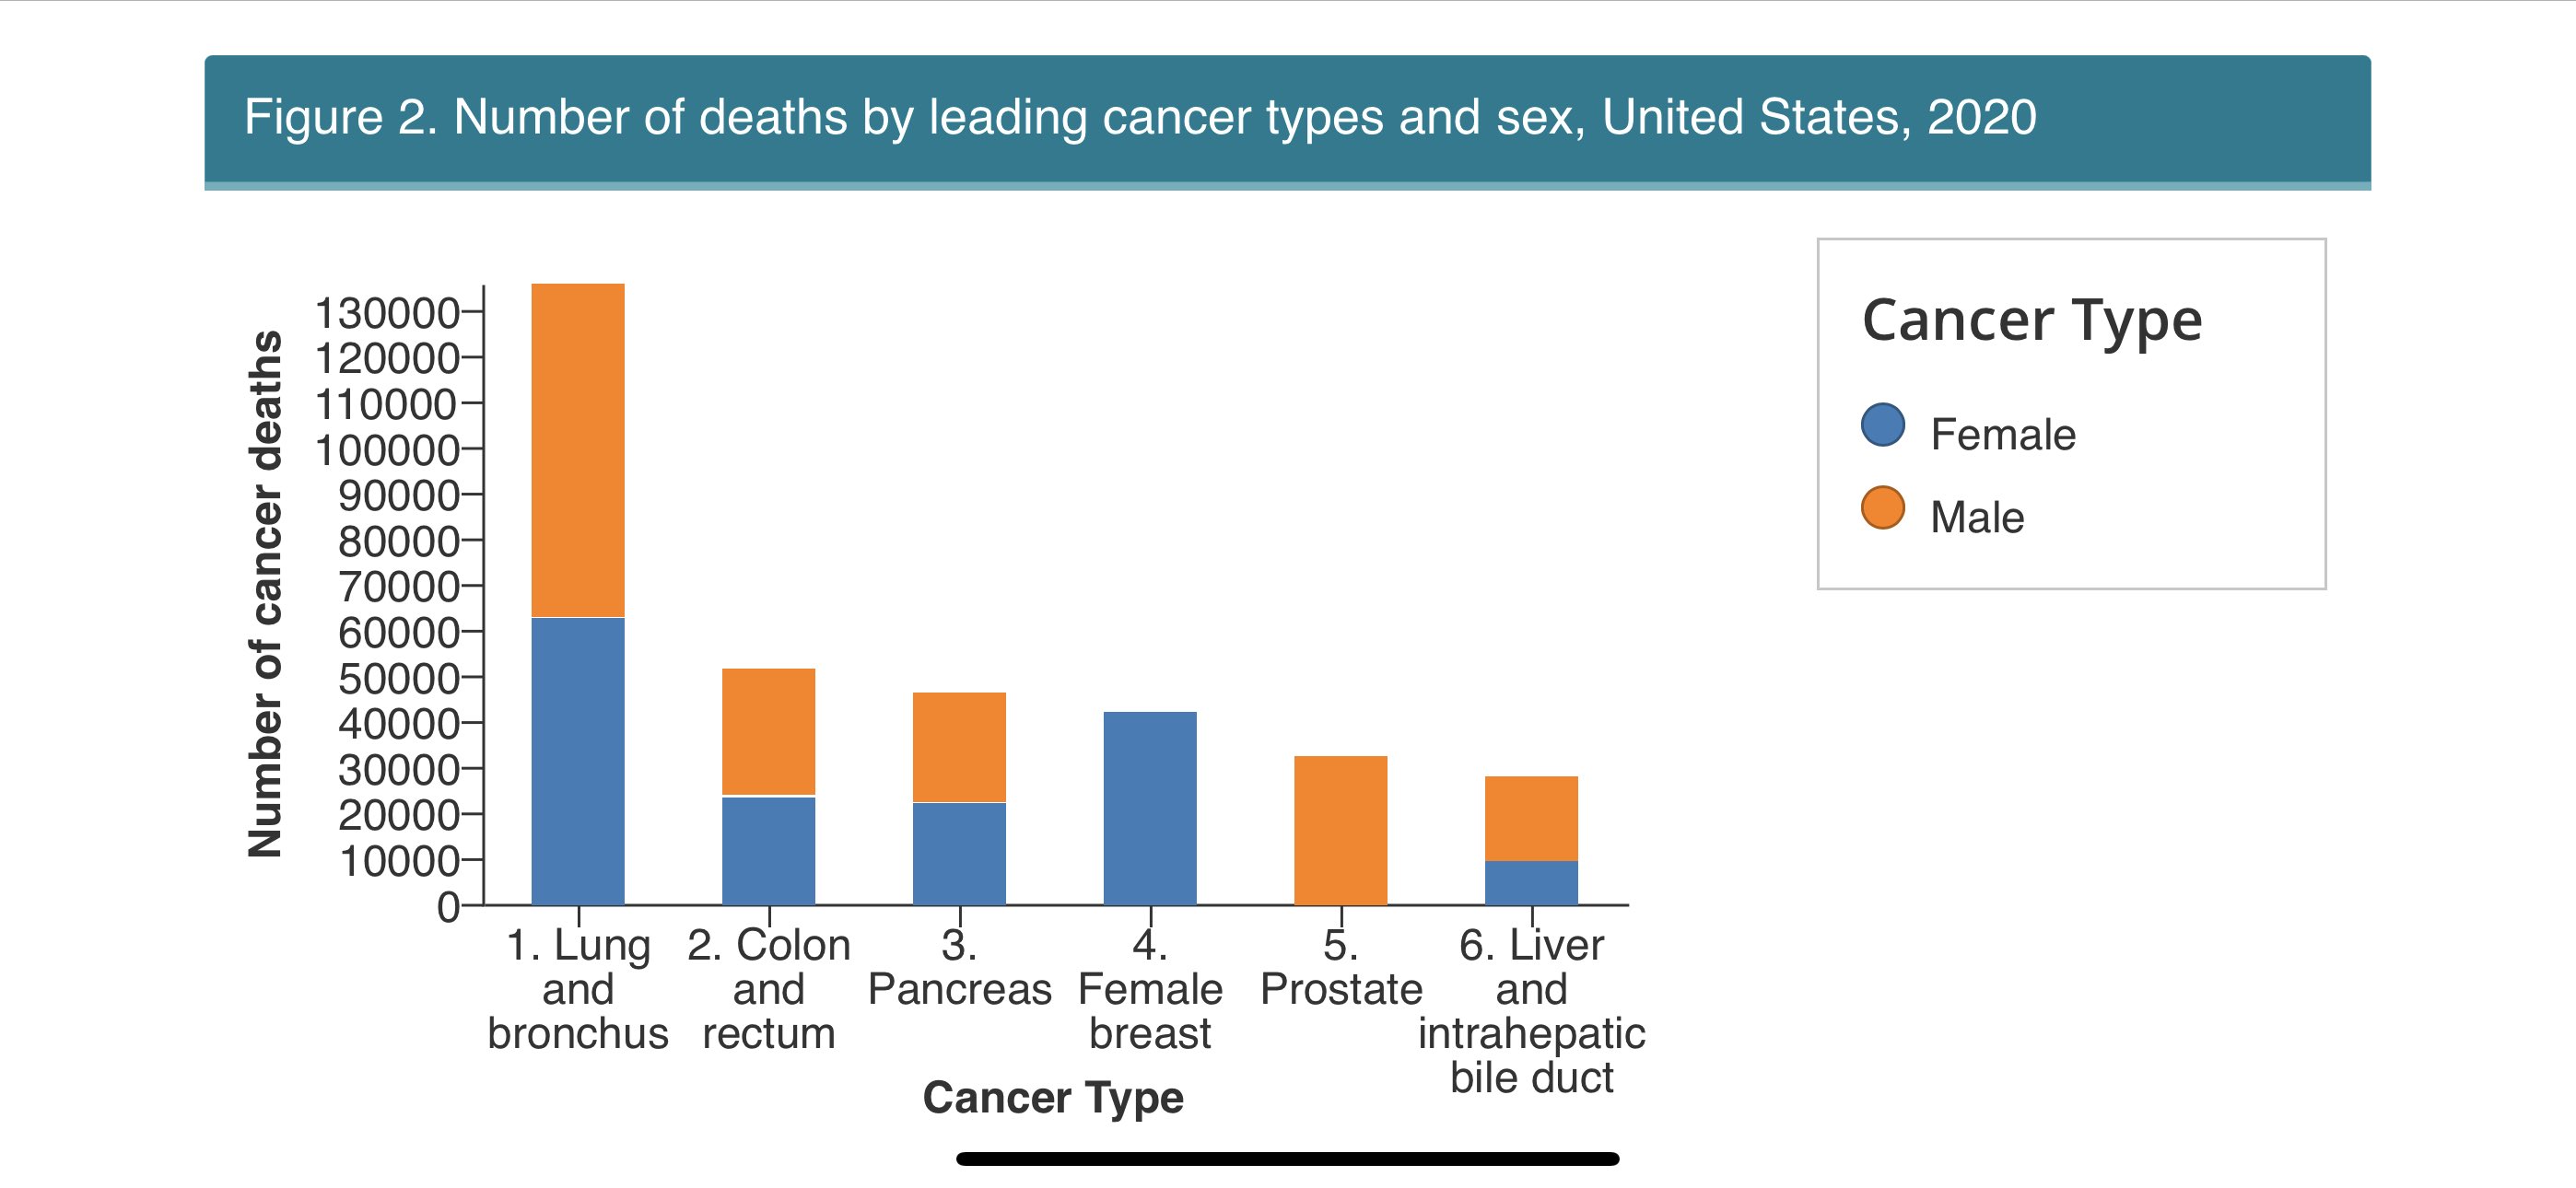
癌故20年下降男32%女26%,肺气管位居第一
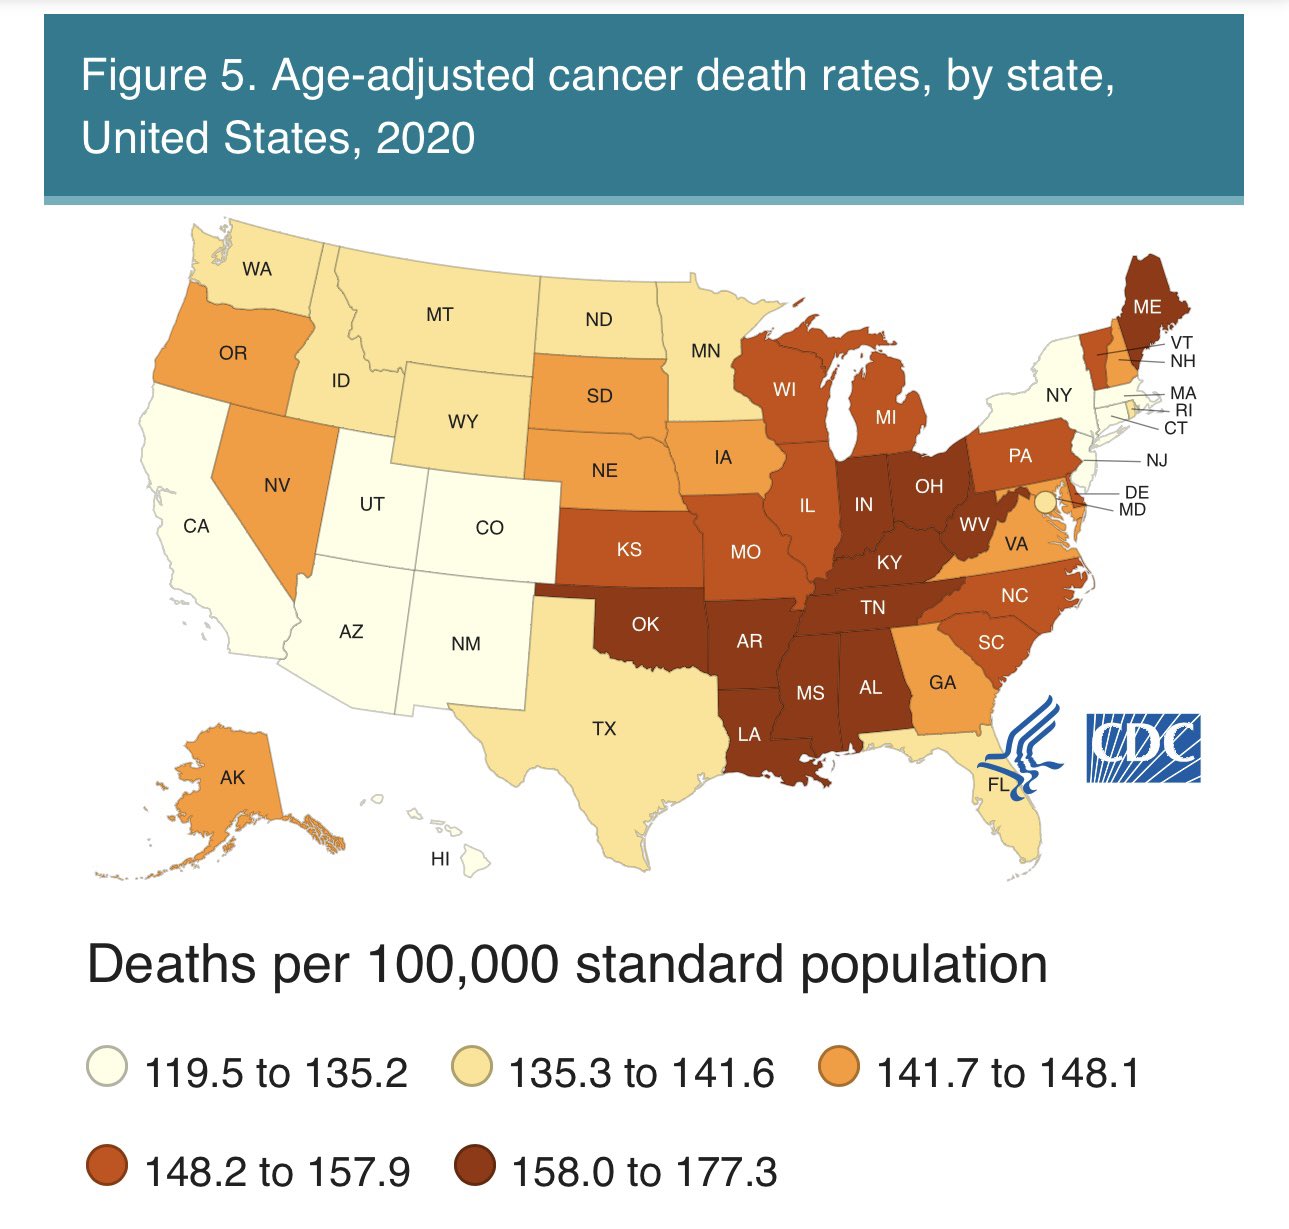
方舟子说蓝州低于红州,难以解释VT高和UT低。
我觉得和海拔有关,高海拔氧气少癌故低。
方舟子原文:
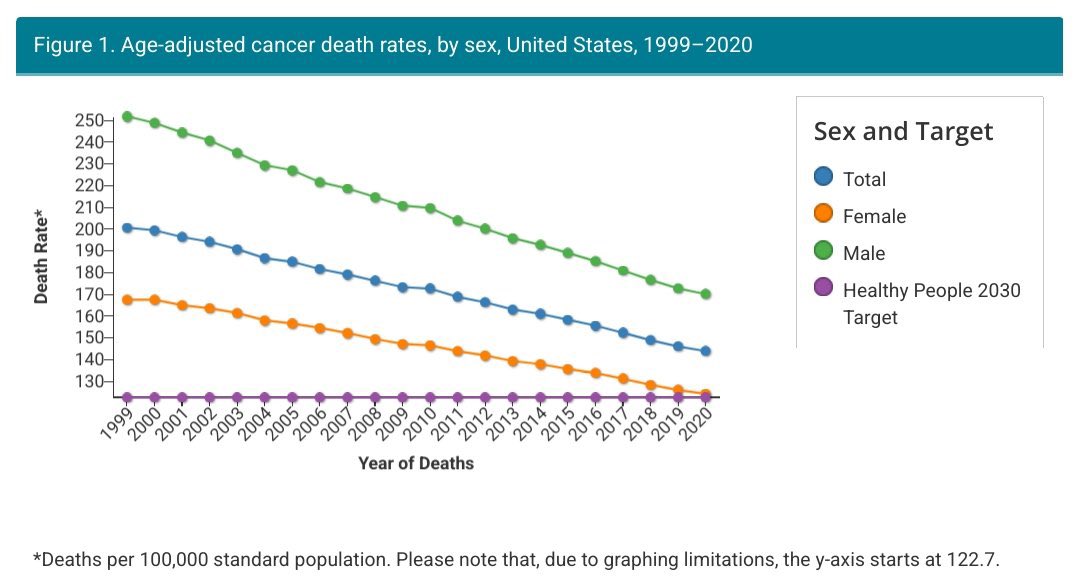
20年来美国癌症死亡率持续下降,从1999年的201(每10万人,下同),下降到2020年
的144,下降28%。性别差异:男人170,女人125。族裔差异:最低为亚裔91,最高为非
裔167。城乡差异:城市140,农村164。州的差异:死亡率最低的州除了犹他、亚利桑
那,都是蓝州;死亡率最高的州无一例外都是红州。


https://www.cdc.gov/nchs/data/nvsr/nvsr68/nvsr68_09-508.pdf
2,813,503 deaths 2017
Results—In 2017, a total of 2,813,503 deaths were reported in the United States. The
age-adjusted death rate was 731.9 deaths per 100,000 U.S. standard population, an increase
of 0.4% from the 2016 rate. Life expectancy at birth was 78.6 years, a decrease of 0.1 year
from the 2016 rate.
Jun 24, 2019
https://www.cdc.gov/nchs/data/nvsr/nvsr69/nvsr69-13-508.pdf
2,839,205 deaths 2018
Results—In 2018, a total of 2,839,205 deaths were reported in the United States. The
age-adjusted death rate was 723.6 deaths per 100,000 U.S. standard population, a decrease
of 1.1% from the 2017 rate. Life expectancy at birth was 78.7 years, an increase of 0.1
year from 2017.Jan 12, 2021
https://www.cdc.gov/nchs/data/databriefs/db395-H.pdf
2,854,838 deaths 2019
In 2019, a total of 2,854,838 resident deaths were registered in the United States—15,633 more
deaths than in 2018. From 2018 to 2019, the age-adjusted death rate for the total population
decreased 1.2%, and life expectancy at birth increased 0.1 year.
https://www.cdc.gov/mmwr/volumes/70/wr/mm7014e1.htm
3,358,814 deaths 2020
In 2020, approximately 3,358,814 deaths occurred in the United States (Table). The age-adjusted
rate was 828.7 deaths per 100,000 population, an increase of 15.9% from 715.2 in 2019.
Apr 9, 2021
https://www.cdc.gov/mmwr/volumes/71/wr/mm7117e1.htm
3,458,697 deaths 2021
In 2021, approximately 3,458,697 deaths† occurred in the United States. From 2020 to 2021, the
age-adjusted death rate (AADR) increased by 0.7%, from 835.4 to 841.6 per 100,000 standard
population.
Apr 29, 2022


