| 華爾街的牛群會狂奔到哪裡? |
| 送交者: sparker 2020年01月21日09:22:17 於 [股市財經] 發送悄悄話 |
|
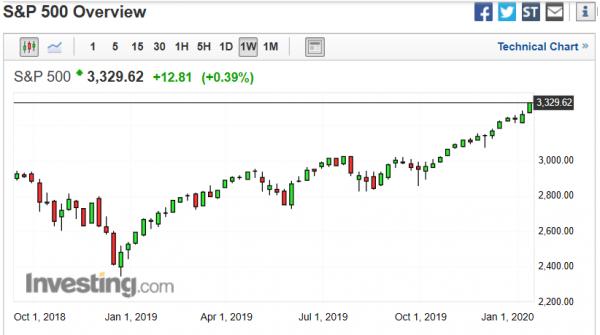
自我去年十月發文《放牛娃們想重溫美好歲月》預測華爾街牛群將開啟狂奔模式後,果然不出我所料,華爾街的牛群在AAPL的帶領下一路狂奔向前,兩個多月來已經狂奔了10%,連稍微休息一下(回調)都沒有。
對於股市的牛群狂奔,在投資界有個描述它的專業術語—Melt-up,說的是在牛市末期牛群頭也不回地一路向前越跑越快地直到墜入懸崖,直譯為“熔沖”,也可叫“末路狂奔”。 關於Melt-up有一篇文章《The 2020 Melt-up And Aftermath》介紹給大家參考,已經附在本文後了。 玩Melt-up非常刺激,首先你要判斷牛群已經進入“末路狂奔”狀態,接着大膽做多,然後在牛群墜崖之前退出(清倉)並反手做空。這樣玩出來的利潤可以是平時做股票投資的好幾倍。 我於2006年次級貸崩盤前玩過一次,收入頗豐,不過那時上班沒時間精力投入在股市,也因是初次玩故只是小試牛刀,這次的Melt-up似乎有可能將是史詩級的,所以也準備玩大一點,同時和網友分享一點我玩Melt-up的體會。 1.首先要判斷牛群已經進入“末路狂奔”狀態。這一點很重要,如果判斷錯誤,有可能你剛買入做多了,市場就遇到一個5%-10%的“回調”把你拍在半年到一年的最高點上。另外,如果你的判斷太遲鈍,當Melt-up已經是眾人皆知,連開出租車的鄰居都要買股票了,你再殺入時就會冒極高的風險。 那麼當前的華爾街是否已經進入Melt-up狀態了呢?我的觀察判斷是有80%的可能Yes。理由就是:市場自從S&P500 衝過了3000點後至今一直沒有正常的“回調”。 事實上,我自從去年12月初就已經開始逐步做多華爾街股市了,至今已達60%的倉位(基於風險控制,我從來不玩滿倉的)。接下來打算再用20%倉位做多黃金並輔以20%的現金在手以控制風險。 2.其次是做多Melt-up。我的建議是:首先做多股指期貨,然後做多個股。做多(或做空)股指可以根據個人的風險承受能力選擇eMini SP500 futures 或者Micro eMini SP500 futures,也可以選擇眾多的S&P500 ETF 或是加槓桿的ETF(比如Direxionn S&P500 Bull/Bear 3X),包括做多股票也可以用CFD加槓桿。不過要注意的是,某些個股可能已經漲幅巨大了(比如Tesla),而某些個股由於自身原因可能會被投資機構提前拋售。此時做多我一般會選前期漲幅不大的個股。 3.最後是在Melt-up的最高點清倉並反手做空市場。這一步也是最難的一步,因為沒人知道Melt-up的最高點在哪裡,每個市場參與者都在博弈,都既想在別人拋售前搶先獲利又想最大化利潤。參與博弈的可大概分為三方:一方為機構投資者的“多方”,一方為機構投資者的“空方”,一方為小投資者散戶。當然Melt-up的前期三方基本都在做多,由於小投資者的力量是分散的形不成合力也左右不了市場,到了Melt-up的中後期就基本是機構投資者的多空雙方主導市場了,而等到了Aftermath of the Melt-up即“大翻轉”後三方則進入做空的熊市博弈。 我前面說“沒人知道Melt-up的最高點在哪裡”是指非主導市場的一方,作為小投資者,因為你的操作對市場的那個“大翻轉”毫無影響,所以你只能被動地去感知市場到來的“大翻轉”,並且做好“感知錯了”的風險管理。你唯一可以慶幸的是你的風險管理比機構投資者容易得多,因為機構投資者的體量決定了他們很難在短時間內管理好已知的風險,所以機構投資者都是預知風險,做提前布局以及多種手段的風險管理。 我前面說“基本是機構投資者的多空雙方主導市場”其實也不準確。作為機構投資者,他們包括了養老基金,保險基金等長期投資者,也包括了對沖基金,投行等中短期投資者,他們有各自不同的投資目標,策略,方法和期限,這決定了無論是多方還是空方,並不存在一個一致行動的同盟在操控市場。他們之所以加入多方或是加入空方,僅僅是當前的做多或是做空操作符合其各自的投資目標和策略。隨着市場的變化,每個機構投資者都在隨時隨地調整其操作策略和多空方向。所以更準確的說法是:機構投資者的多空雙方之間的博弈在主導着市場。所以機構投資者也是在感知市場的“大翻轉“,只不過對他們來說,感知到的信息是其主動操作的反饋,如此他們能夠比小投資者更早地感知到甚至去預判那個“大翻轉”。 所以,回到本文的題目,如果還有人要問:你說華爾街的牛群狂奔是Melt-up,那麼最高點在哪裡? 我只能告訴你:在“大翻轉”來臨之前,即便是機構投資者也不確切知道最高點在哪裡! 換句話說,Melt-up的高度和形態並非是一成不變有規律的,雖然附文中提到了比特幣的Melt-up在一個月翻了一倍,2000年的互聯網泡沫中Nasdaq市場的Melt-up在六個月翻了一倍,以及2015年上海股市的Melt-up在兩個月翻了一倍,但在我看來都是有特定客觀條件存在的極端特例,我不會就此設定當前華爾街Melt-up的最高點和走勢形態。 我在去年時發文談“認知有限論”(見《讀“戲說宇宙”有感兼談認知有限倫》)中提到過,我從不假定市場的未來走勢和目標,我習慣於每天去重新評估和認知市場,去感知任何潛在的市場“Move”,並以此做操作決策的基礎。 說到這裡,如果你還是覺得自己無法把握這最後一步,那就不要玩Melt-up了,離場觀望等待自己有把握的機會當是更好的選擇。
最後,也許會有網友說我不夠厚道:你自己已經買好了倉位後再來發此文忽悠大家買多Melt-up,那不是讓大家給你抬轎嗎?現在股市已經都進入Melt-up兩個多月了,漲了這麼多還能買入做多嗎? 對此我想說以下幾點: 1.我12月初開始買入時對Melt-up的認知並不是確定的,僅僅是一種牛市裡的做多。我對Melt-up的確認和信心也是一天天在增長的,我至今相信華爾街已經有80%的可能走入了Melt-up也僅僅是我個人的評估,並不是投資界的共識。本文只是分享對Melt-up的一點個人體會,任何人都不應該以本文為依據做投資決策並應該對自己的任何投資決策負全責。 2.玩Melt-up的最大利潤不是來自做多Melt-up,而是來自於對“大翻轉”之後的市場做空。如果你坐過“雲霄飛車”,你就知道最刺激的時刻是在過了最高點之後。所以,玩Melt-up首先你心臟要強壯,其次你完全可以不做多隻做空,前提是你能夠及時正確判斷最高點。對於我來說,我只有參與進Melt-up(即做多)才能有助於我判斷最高點和做空,完全是個人偏好。 3.玩Melt-up風險很大,強烈建議做好止損和對沖。止損的設置可以是1%--5%取決於你是何時做多/做空Melt-up的,這裡就不展開細說了。對沖可以選擇Opertions或黃金,我選擇的是買入一定的黃金做對沖。 4.時時警惕黑天鵝的出現,要知道某些黑天鵝事件有可能會使走到一半的Melt-up就此結束並翻轉。當突發事件發生時,如果你不確定其後果,可以及時減倉或清倉以規避風險。這屬於風險管理,每個人應該有自己的風格和策略,這裡也不展開細說了。 5.不要想當然地認為Melt-up的最高點都是一劍沖天的Spike形態,未必! Spike走勢比較容易判斷最高點,卻不常出現。同時也不要想當然地用某個時間段來確定最高點,只要記住:Melt-up是市場參與各方博弈的結果,並沒有一定之規可循。
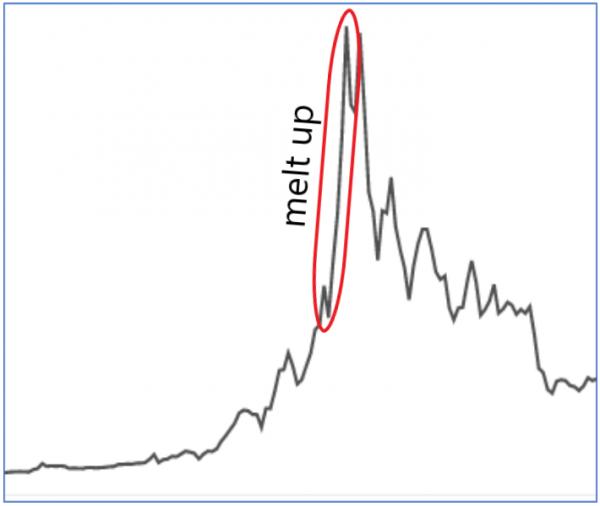
聲明:本文內容完全出自個人觀點,不代表任何投資機構也非投資建議,本人也沒有因寫此文而收取任何利益,本人也與此文中提到的公司沒有任何關係。 附文 The 2020 Melt-Up And Aftermath Summary The market melt-up is in full swing. A melt-up with a subsequent crash similar to 2000 is now all but certain. History shows us that markets tend to melt up 100% or more before bursting in major bubbles. Timing melt-ups and their aftermath is extraordinarily difficult, but not impossible. We currently see behavioral finance in action. In the U.S., it was way back in 1999 when we last saw this irrational behavior in the markets. It is tricky to spot, being right in the middle of it, but the parameters are starting to line up beautifully for a March 2000 replay. Last year, I highlighted the risks of the emergent dot-com market sentiment. Although the risk factors were already brewing, at that time the environment wasn't quite ripe for a significant crash. Valuations last year were elevated, and the dot-com era parallels were starting to crystallize. However, some key signs were still missing that are starting to manifest: · Significant market euphoria à la late 1999. · Dismissal of bad news that, just months ago, would have caused large swings to the downside. · High amount of investor leverage, either via margin borrowing or investing through leveraged products. · Irrational sell-side analyst calls and talking head predictions. These factors are steadily increasing. I will analyze these and others in more detail below. The origin of a market bubbleAs more market participants realize the quick rise of the markets, everyone seeks opportunity to benefit from the gain. Even those that are aware of the market melting up are attempting to profit. Leveraged buying further fuels the bubble. Plenty of investors know that this will end sooner or later and they have to exit rapidly. Most investors believe they can get the timing just right. Unfortunately, the math is stacked against them. Those that are oblivious to the situation are certainly left holding the bags. Bubble behaviorSo, what do we know about the general behavior of bubbles? Are there any patterns? It takes a certain amount of pressure for a bubble to burst. When looking at bubbles across the last decades in assets such as stocks, bitcoin and commodities, you will be hard-pressed to find a bubble that burst before melting up at least 40%. Some bubbles melted up 100% or more. The start of this melt-up is usually not immediately apparent at the time. Once it becomes evident, investors leverage up and expose themselves to tremendous downside risk.
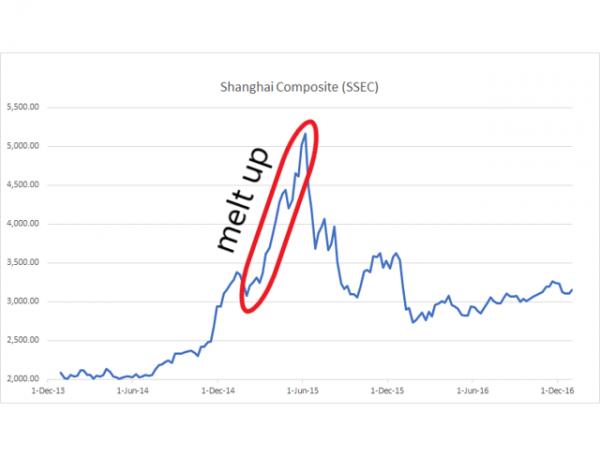
Bitcoin price 2016-2018 (Data source: Coinbase) One of the most extreme examples in recent times was Bitcoin. In 2017, Bitcoin more than doubled within one month. It subsequently lost almost all of the gain once the bubble burst just as quickly as it had gained it. Nasdaq Composite (Source: Wikipedia) When the Nasdaq Composite peaked on March 10, 2000 at 5,048.62, it had almost doubled within six months. When the reckoning came, the drop was sharp. The Nasdaq lost over 30% within a month. It took around a year to descend down to where the melt-up started and then further down from there. The bubble in the Shanghai Composite (SSEC) in 2015 unfolded slightly differently. Although in retrospect it appears to follow a similar path, it would have been much harder to tell at the time how inflated this bubble actually was. The market was rising sharply, but the true melt-up really didn't start until March 2015. Within two months, the index doubled - although it already rose sharply before that.
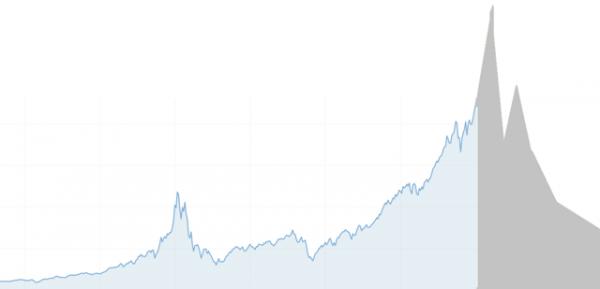
The 2020 melt-upSo how high can we go? For those that think we are currently about to crash, let me illustrate that markets can rise tremendously. Below is a hypothetical scenario of the Nasdaq Composite, should it follow a typical bubble trajectory, in which the market doubles. In this scenario, the Nasdaq 100 could rise to over 14,000. I would argue this scenario is not that unlikely. We would know the answer in three months in the scenario below.
The AftermathThe examples above show that the drop after the bubble bursts is typically even quicker than the melt-up. The typical drop is at least 20% or more. Frequently, a dead cat bounce follows, until the bubble continues its decline down to a level well below the original melt-up. Timing the dropIf we could improve our timing of when this market peaks, we would have a tremendous opportunity to reduce our risk and potentially even profit. As I mentioned above, every investor thinks they are an above-average driver, but that math just doesn't work out. However, I have also shown that there are plenty of clear similarities in most bubbles throughout history. Apart from just price movement, many other factors can assist in improving the timing of when the bubble will burst. Market sentiment A significant amount of exuberance, to the level of euphoria, needs to be present for a bubble to inflate. And once we get that irrational level of exuberance, we're close to a popping bubble. This is a very subjective assessment. There are some clear indicators of market sentiment, such as reactions to bad news. Economic indicators that tended to get significant negative market reaction just a couple of months ago are now completely brushed aside. The recent Iran conflict barely made a dent in the market. These are all signs of a level of exuberance that overshadow all potential negativity. Leverage Starting in November 1999, margin debt skyrocketed. Investors leveraging up is a distinctive sign of risk-taking and attempts to benefit from rapid rises in prices. With the availability of leveraged products such as the ProShares UltraPro QQQ ETF (TQQQ), individual investors are able to be highly leveraged without the need for large margin debt. This may be the reason why we have not yet seen that large of an increase in margin debt. However, FINRA, which reports on margin debt, so far hasn't reported any data more recent than November 2019. I expect there to be a large jump in the margin debt in the December 2019 data to be released shortly. I suggest to keep a close eye on this. Valuations The Shiller P/E (CAPE) ratio is over 30, one of the highest values in history. However, it hasn't moved much for over a year. For comparison, the ratio was at an all-time high of 44 in December 1999. As the large S&P 500 components, Apple (AAPL) in particular, are further bid up, the Shiller P/E may rise to new heights well. This would truly be the writing on the wall. Volume and Volatility Trading volume and volatility are other indicators that show similarities across market bubbles but are not as clear-cut. Increases in trading volume are often associated with general euphoria. Similar to increases in leverage, more market participants want to be part of the action and trade higher volume. Volatility may be helpful to determine if the market turned or is just giving up some gains. Attempting to time the actual turn bears a tremendous amount of risk. Typically, a market turn creates a very significant spike in volatility within a couple of days with a drop in the market of several percent - a sort of collective reckoning that the bubble may have burst. Unless properly prepared, this can already destroy one's portfolio. An example where the market retreated without a major spike in volatility was the Iran crisis. The options market clearly wasn't concerned about a bursting bubble or we would have seen a much larger spike in the VIX. Personal assessmentIf there are no major geopolitical events, trade wars, earnings misses, and the like, I don't see any indication why this bubble wouldn't inflate similar to what we have seen in the past. That would mean a sharp rise into March at the same rate we are climbing right now. However, the higher the market rises, the more certain we can be that we will have a market decline not seen since the dot-com bubble. Highly leveraged investors lost vast sums of money within days. The market will most certainly return to a level we are currently at, so the most prudent move is to get out now. |
|
|
 |
 |
| 實用資訊 | |
|
|
| 一周點擊熱帖 | 更多>> |
| 一周回復熱帖 |
| 歷史上的今天:回復熱帖 |
| 2018: | 交易員實戰1月第3周結果 | |
| 2018: | 交易員實戰1月第4周計劃 | |
| 2016: | 2016年運勢 | |
| 2016: | 3.33丌亿美元外储=奶å | |
| 2015: | 日月樓主:2015年稅法的變化 | |


