| Gold 2015 Trend Forecast(zt) |
| 送交者: AhQ2003 2014月11月19日21:41:38 於 [股市財經] 發送悄悄話 |
| 回 答: 第五屆股壇大師賽金牌榜【第7周】 由 穿牆屁 於 2014-11-15 18:03:33 |
|
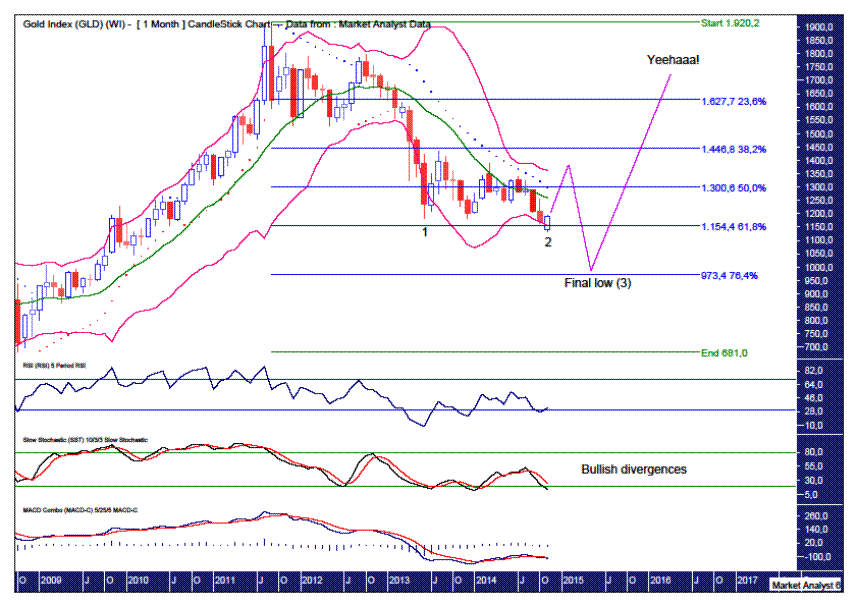
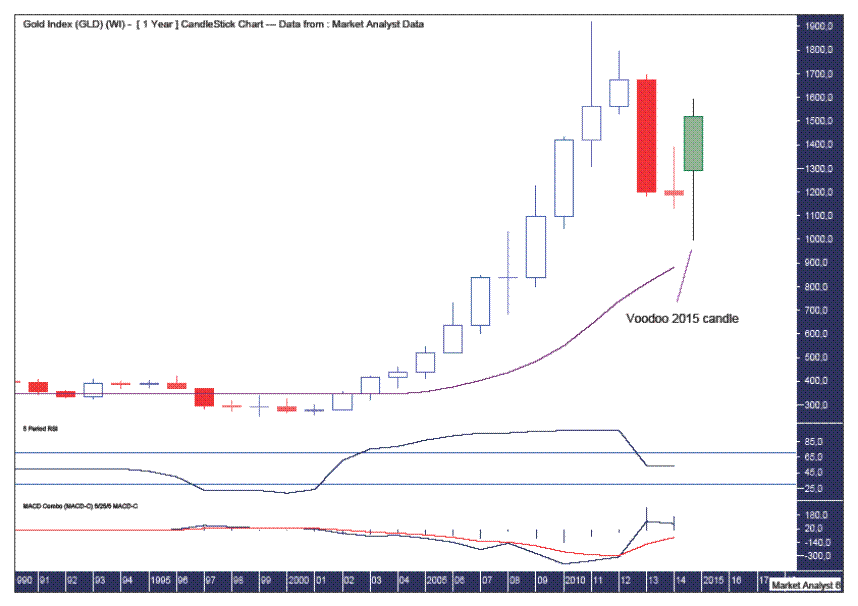
Let’s take a look at the charts beginning with gold. GOLD GOLD WEEKLY CHART We can see price recently breaking down below the triple bottom support level at US$1180. This led to a throng of analysts calling doom and gloom and armageddon dead ahead for gold. What they failed to comprehend was that this support was just too obvious and when something is that obvious then what follows will generally not be what popular consensus dictates. Now determining the contrarian position is easier said than done but these setups don’t get much easier than what we have just witnessed with gold. The break of obvious support combined with the plethora of bearish forecasts was the perfect setting for a rally. That is, when people least expect it. So we have a false break low in place at US$1132. The recent triple bottom support became resistance and recovering above there now is a bullish sign. The low was also accompanied by bullish divergences on the Relative Strength Indicator (RSI) and Stochastic indicator. Nice. So how high can we expect this rally to reach? I have drawn a green highlighted rectangle which I’ve labelled the Voodoo Fake Out Zone. The bottom of this zone is the July 2014 high at US$1339 while the high is the March 2014 high at US$1387. I expect price to trade up into this area. Why? Firstly, the black downtrending line which I’ve drawn across the tops of August 2013 and March 2014 will provide the first fake out. This trend line is on the radar of virtually all chartists so it is very obvious. That fact alone means it will probably be a fake out. But don’t tell the other chartists that! Busting above this trend line will get the gold bulls hooting and hollering with giddiness. That should lure in more bulls for the slaughter. That next round of buying should provide price with the momentum to trade up into the next fake out area – the Voodoo Fake Out Zone. The bottom of the zone is the July high which many Elliott Wave technicians have labelled wave 4. So taking out that level would imply the recent low is the final wave 5 low. They will be jumping on the bullish bandwagon when they see price trade above the “wave 4” level. This will be the final fake out and I can already see their flummoxed expressions when price turns back down. If my analysis is correct, price should not trade above the March 2014 at US$1387. If it does then it will be me that is flummoxed. I doubt it. I have added Fibonacci retracement levels of the move down from August 2013 high to the recent low. I’m looking for price to get up to around the 76.4% level which stands at US$1361. I suspect a touch higher. Let’s move on to the monthly chart. GOLD MONTHLY CHART I have added Bollinger Bands which show price finding support around the lower band. I now expect price to trade back up to the upper band which is currently just above US$1360. This toing and froing between the bands is consistent with a consolidating market. The lower indicators, being the RSI, Stochastic and Moving Average Convergence Divergence (MACD) indicator, are all showing this recent low to be accompanied by bullish divergences. More evidence that a decent rally higher is at hand. I have the Parabolic Stop and Reverse (PSAR) indicator, which pertains to the dots, and I expect this rally to trade up and bust these dots in order to unwind the bearishness given from this indicator. That would then set the stage for the move to final lows. I have added Fibonacci retracement levels of the move up from 2008 low to 2011 high. This recent low was right around the 61.8% level so price finding support now was no surprise. Well, not to me anyway. Once this rally is over I am looking for price to make its final low around the 76.4% level at US$973. This is also close to one of Gann’s favourite bottom targets being 50% of the high price which would be US$960 in this case. And importantly, both these levels stand below the psychological US$1000 level. Finally, we now have a “three strikes and you’re out” low formation in play. That is, three consecutive lower lows. This recent low was the second low so we now just require the third and final low. Now because this second low was only marginally lower than the first low I expect the third and final low to be much lower than the second low. A low sub US$1000 looks to fit in perfectly here. As for the timing, May is a seasonally low point for gold so I’m looking for the final low to occur in May 2015. Now let’s rip out some Voodoo magic with the yearly chart. GOLD YEARLY CHART The RSI still has a reading in positive territory consistent with bull market pullbacks while the MACD has a bullish bias with the blue line above the red line. I have drawn voodoo style the 2015 candle. This is how I expect price to trade next year. It calls for one final plunge which should find support close to the 14 period moving average. Then a big reversal which sees price close out the year with bang. I haven’t yet drawn the 2016 candle but I suspect it will be challenging, if not taking out, the all time high set in 2011 at US$1920. Yeehaaa! |
|
|
 | |
|
 |
| 實用資訊 | |
|
|
| 一周點擊熱帖 | 更多>> |
| 一周回復熱帖 |
| 歷史上的今天:回復熱帖 |
| 2013: | Shareholder Proposal to Goldman Sach | |
| 2012: | 從兩張圖看蘋果的走勢 | |
| 2012: | 人民幣連續12日漲停 熱錢真的來了 | |
| 2011: | 歐債危機為什麼愈演愈烈? | |
| 2011: | 理財高手的七個好習慣 | |
| 2010: | 美國股市上周單周跌幅為三個月來最大 | |
| 2010: | 黃金也瘋狂?不可能! | |
| 2009: | 人大代表勾結政協委員坑騙美籍台商200 | |


